Interactions
A force is one field being coupled to another. The pictures everyone recognises — the little diagrams with wiggly lines — are not pictures of events at all, and knowing what they actually are makes the most precise prediction in science comprehensible.
- Say what an interaction is in the field picture, and what the coupling constant sets
- Say what a Feynman diagram is a picture of, and what it is not
- Explain why QED can be calculated to ten digits and the strong force cannot be calculated this way at all
The fields in this act have so far been alone. One field, its modes, its quanta, its vacuum. But electrons push on each other. Light pushes on electrons. Nothing written down so far permits any of that — two fields could occupy the same region of space forever and remain entirely unaware of one another. Something has to be added, and what has to be added is remarkably specific.
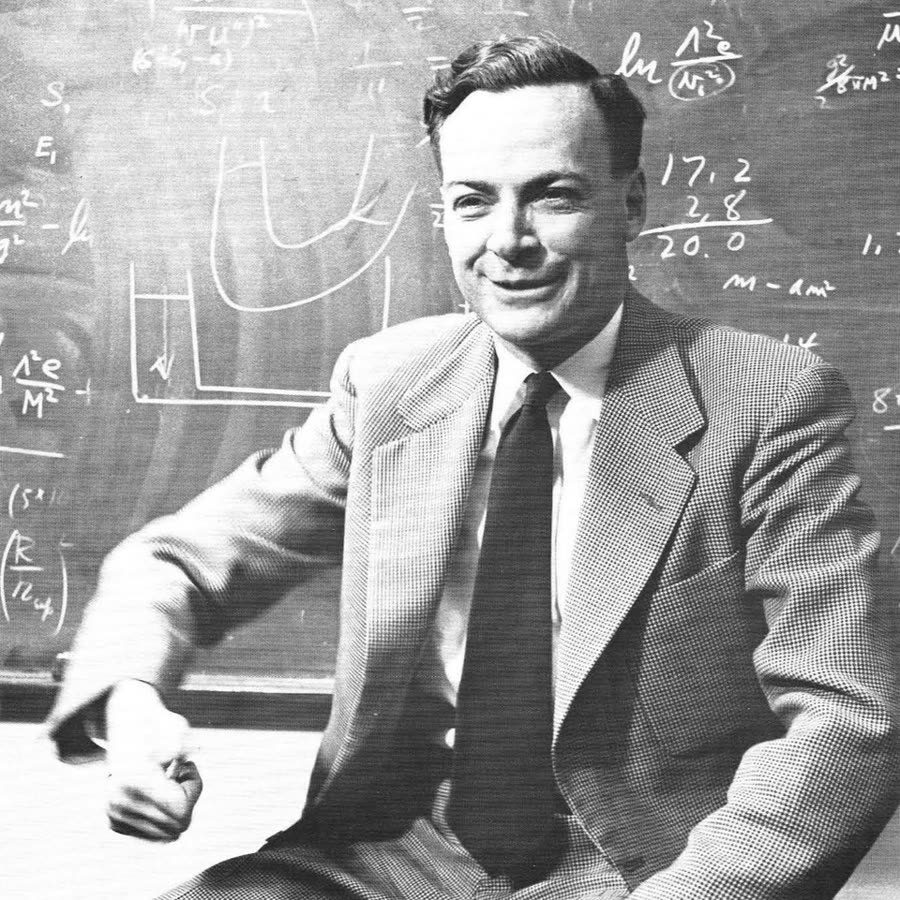
1959. Public domain
Set the coupling to zero: nothing ever crosses. Then set it very low but not zero, and wait. Notice that what changes is the rate, not the amount.
For electromagnetism, the coefficient is a number met back in Act 5: the fine-structure constant, α ≈ 1/137.036. It is dimensionless. No units, no scale, nothing to compare it against — just a number, and nobody knows why it has the value it has. Feynman: "It has been a mystery ever since it was discovered more than fifty years ago, and all good theoretical physicists put this number up on their wall and worry about it."
What a Feynman diagram actually is
A Feynman diagram shows what happens: two electrons approach, exchange a photon, and fly apart.
It is a term in a series, and the series is an approximation scheme. When a problem cannot be solved exactly, you expand it in powers of something small. Here that is the coupling. The answer becomes a sum: a leading term, plus a correction of order α, plus one of order α², and onwards. Every term is an integral, and the diagrams are a notation for writing those integrals down — one diagram, one term, with precise mechanical rules for translating between them. The rules are the content. The picture is a mnemonic for the rules.
This settles what the internal lines are. In the diagram where two electrons exchange a photon, that photon is an internal line, and it does not satisfy E² = (pc)² + (mc²)². It is off shell — it has the wrong relationship between energy and momentum to be a photon at all. It is a factor in an integrand, integrated over every value it could take. So it is not a particle that briefly existed while nobody was looking. There is no moment at which it is there.
The most precise prediction in science
The Dirac equation says the electron’s g-factor — how strongly its spin couples to a magnetic field — is exactly 2. Measure it and it is not exactly 2. It is about 2.00231930436. The excess is called the anomaly, a = (g−2)/2, and it exists because the electron is coupled to the electromagnetic field. Calculating it is the longest-running hard calculation in physics.
Start at order 1 — Schwinger’s single diagram — and add orders one at a time. Watch the diagram count explode and the returns diminish.
Weighing the magnetism of one electron
- The question
- What is the electron’s magnetic moment, measured well enough to test QED to its limit?
- The apparatus
- A single electron held in a Penning trap — a combination of magnetic and electric fields — cooled to 100 mK so that it sits in its lowest cyclotron state. Its spin-flip frequency and its cyclotron frequency are measured on the same particle, and the ratio gives g/2 directly, with most systematic errors cancelling.
a = 0.00115965218, from five orders of QED plus small hadronic and weak contributions.
a = 0.00115965218059, with an uncertainty of 13 in the last two digits (2023).
How sure could they be? A fractional uncertainty of 1.1 × 10⁻¹⁰ on the anomaly. The comparison with theory is now limited not by this measurement but by how well α is independently known.
This is the most precisely measured quantity in physics and the most precisely tested prediction in science. It is also a direct test that the field picture is right: the anomaly exists only because the electron is coupled to a field, and its size is fixed by the coupling.
There is something unexpected about what limits the comparison now. It is not the calculation, and it is not the electron measurement. The prediction requires a value of α obtained some independent way — and the two best determinations, one from caesium recoil and one from rubidium, disagree with each other by more than their stated uncertainties. The most precise test in science is currently waiting on a disagreement about the number it has to be fed.
- 1928Dirac: the electron’s g-factor is exactly 2.
- 1947Kusch and Foley find it is not exactly 2. Lamb finds his shift the same year.
- 1948Schwinger computes α/2π and matches the measurement. Feynman introduces the diagrams.
- 1949Dyson proves the Feynman, Schwinger and Tomonaga formulations are the same theory.
- 1965Nobel prize to Feynman, Schwinger and Tomonaga.
- 2008Harvard reaches the tenth digit of the anomaly.
- 2020The caesium and rubidium measurements of α disagree, limiting the test.
- 2023Northwestern improves the measurement again: a = 0.00115965218059(13).